VLab
Online Student Registration
Tcpstat
Web mail
Contacts
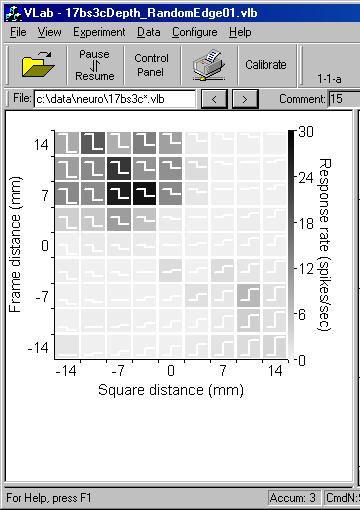
This is the edge plot. The gradient of the small squares indicates the response rate of the neurons. The Z shape inside the small square indicates the visual stimulus (here is step edge).